$1,000 in 1945 Is Worth $18,551 Today
What is $1,000 in 1945 worth today?
Answer
Prices rose 1,755.1% between 1945 and today, a difference of $17,551 over 81 years.
$1,000 in 1945, broken down
Increase: $17,551
Total inflation over 81 years: 1,755.1%
Average per year: 3.67%
How this is calculated
Source: CPI-U, series CUUR0000SA0, U.S. Bureau of Labor Statistics.
Related Calculations
See Also
- Inflation Rate Since a Given Year - Cumulative and average US inflation from any year to today
 <a href="https://calculat.io/en/money/inflation/1000--1945">$1,000 in 1945 Is Worth How Much Today? - Calculatio</a>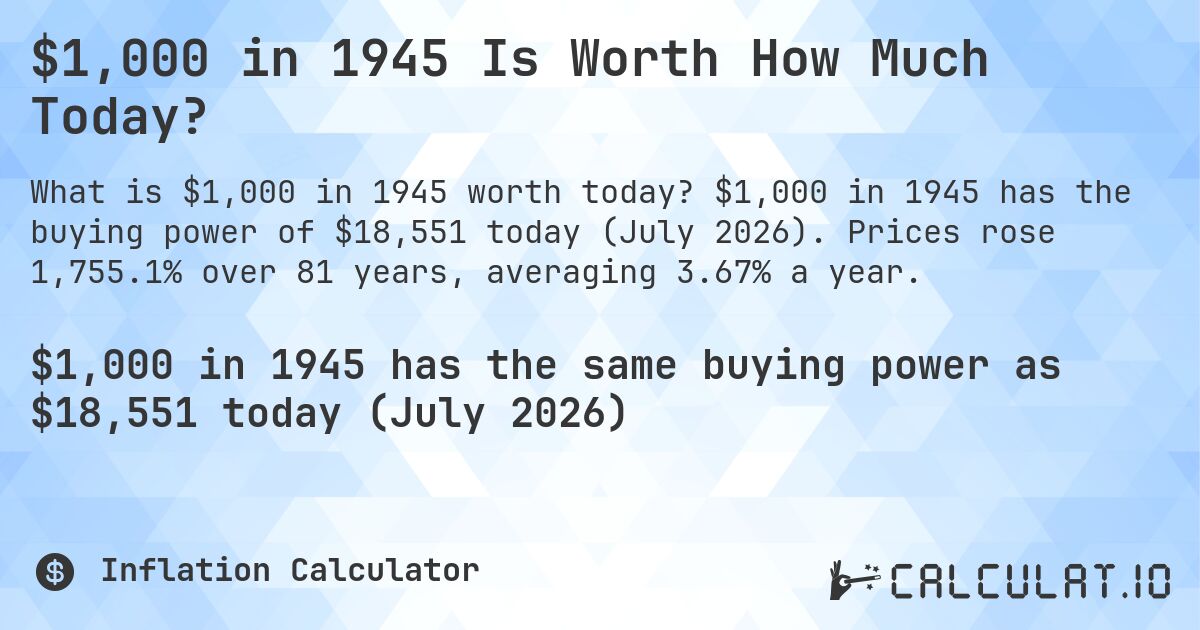
Value of $1,000 by Year
| Year | Value of $1,000 today | Total inflation | Average per year |
|---|---|---|---|
| 1930 | $19,995.09 | 1,899.51% | 3.17% |
| 1931 | $21,968.29 | 2,096.83% | 3.31% |
| 1932 | $24,373.58 | 2,337.36% | 3.46% |
| 1933 | $25,686 | 2,468.6% | 3.55% |
| 1934 | $24,919.25 | 2,391.93% | 3.56% |
| 1935 | $24,373.58 | 2,337.36% | 3.57% |
| 1936 | $24,022.88 | 2,302.29% | 3.6% |
| 1937 | $23,188.75 | 2,218.88% | 3.6% |
| 1938 | $23,682.13 | 2,268.21% | 3.66% |
| 1939 | $24,022.88 | 2,302.29% | 3.72% |
| 1940 | $23,851.29 | 2,285.13% | 3.76% |
| 1941 | $22,715.51 | 2,171.55% | 3.74% |
| 1942 | $20,485.77 | 1,948.58% | 3.66% |
| 1943 | $19,301.62 | 1,830.16% | 3.63% |
| 1944 | $18,972.61 | 1,797.26% | 3.65% |
| 1945 | $18,551 | 1,755.1% | 3.67% |
| 1946 | $17,124 | 1,612.4% | 3.61% |
| 1947 | $14,973.90 | 1,397.39% | 3.49% |
| 1948 | $13,855.52 | 1,285.55% | 3.43% |
| 1949 | $14,030.17 | 1,303.02% | 3.49% |
| 1950 | $13,855.52 | 1,285.55% | 3.52% |
| 1951 | $12,843 | 1,184.3% | 3.46% |
| 1952 | $12,600.68 | 1,160.07% | 3.48% |
| 1953 | $12,506.29 | 1,150.63% | 3.52% |
| 1954 | $12,413.31 | 1,141.33% | 3.56% |
| 1955 | $12,459.63 | 1,145.96% | 3.62% |
| 1956 | $12,276.40 | 1,127.64% | 3.65% |
| 1957 | $11,883.20 | 1,088.32% | 3.65% |
| 1958 | $11,554.26 | 1,055.43% | 3.66% |
| 1959 | $11,474.85 | 1,047.48% | 3.71% |
Inflation Calculator
This calculator answers one question: what a sum of money from a past year is worth in today's prices. Enter the amount and the year it was spent or earned, and the result is the equivalent in dollars as of July 2026.
Enter the amount: the sum in the dollars of the earlier year.
Enter the year: any year from 1913 to 2025.
Read the result: the equivalent amount today, the total price growth over the span, and the average yearly rate that adds up to it.
So $1,000 in 1945 has the same buying power as $18,551 today — prices rose 1,755.1% over those 81 years, which averages 3.67% a year.
The figures come from the Consumer Price Index for All Urban Consumers (CPI-U), the series the U.S. Bureau of Labor Statistics publishes for exactly this purpose. Each past year is represented by the annual average BLS itself publishes for it, and today by the most recent published month, July 2026. Because the whole answer is a function of that published table, it does not drift from day to day; it changes when BLS releases a new month.
One limit worth naming: the CPI measures a national basket of goods and services. It is the right instrument for "what was this worth", and the wrong one for any single item, because rents, tuition, computers and eggs have not moved together.
For example, it can help you find out what is $1,000 in 1945 worth today? (The answer is: $18,551).